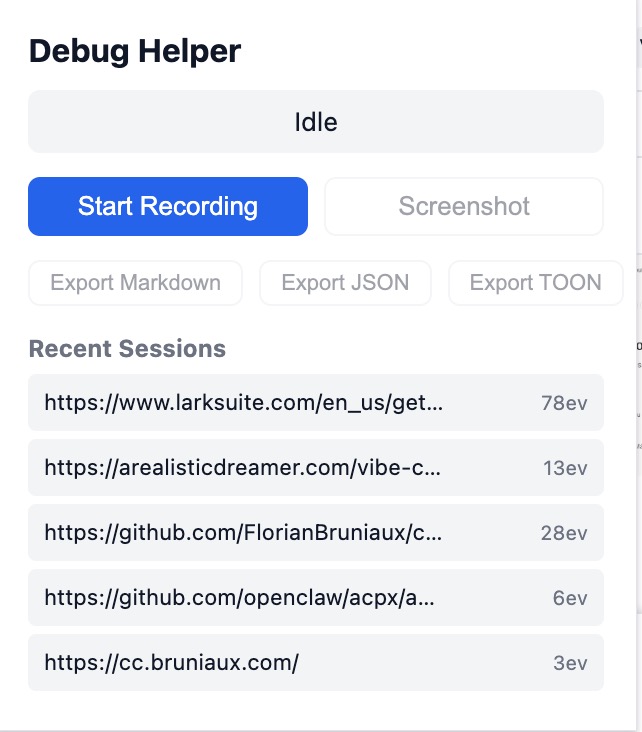
Popup
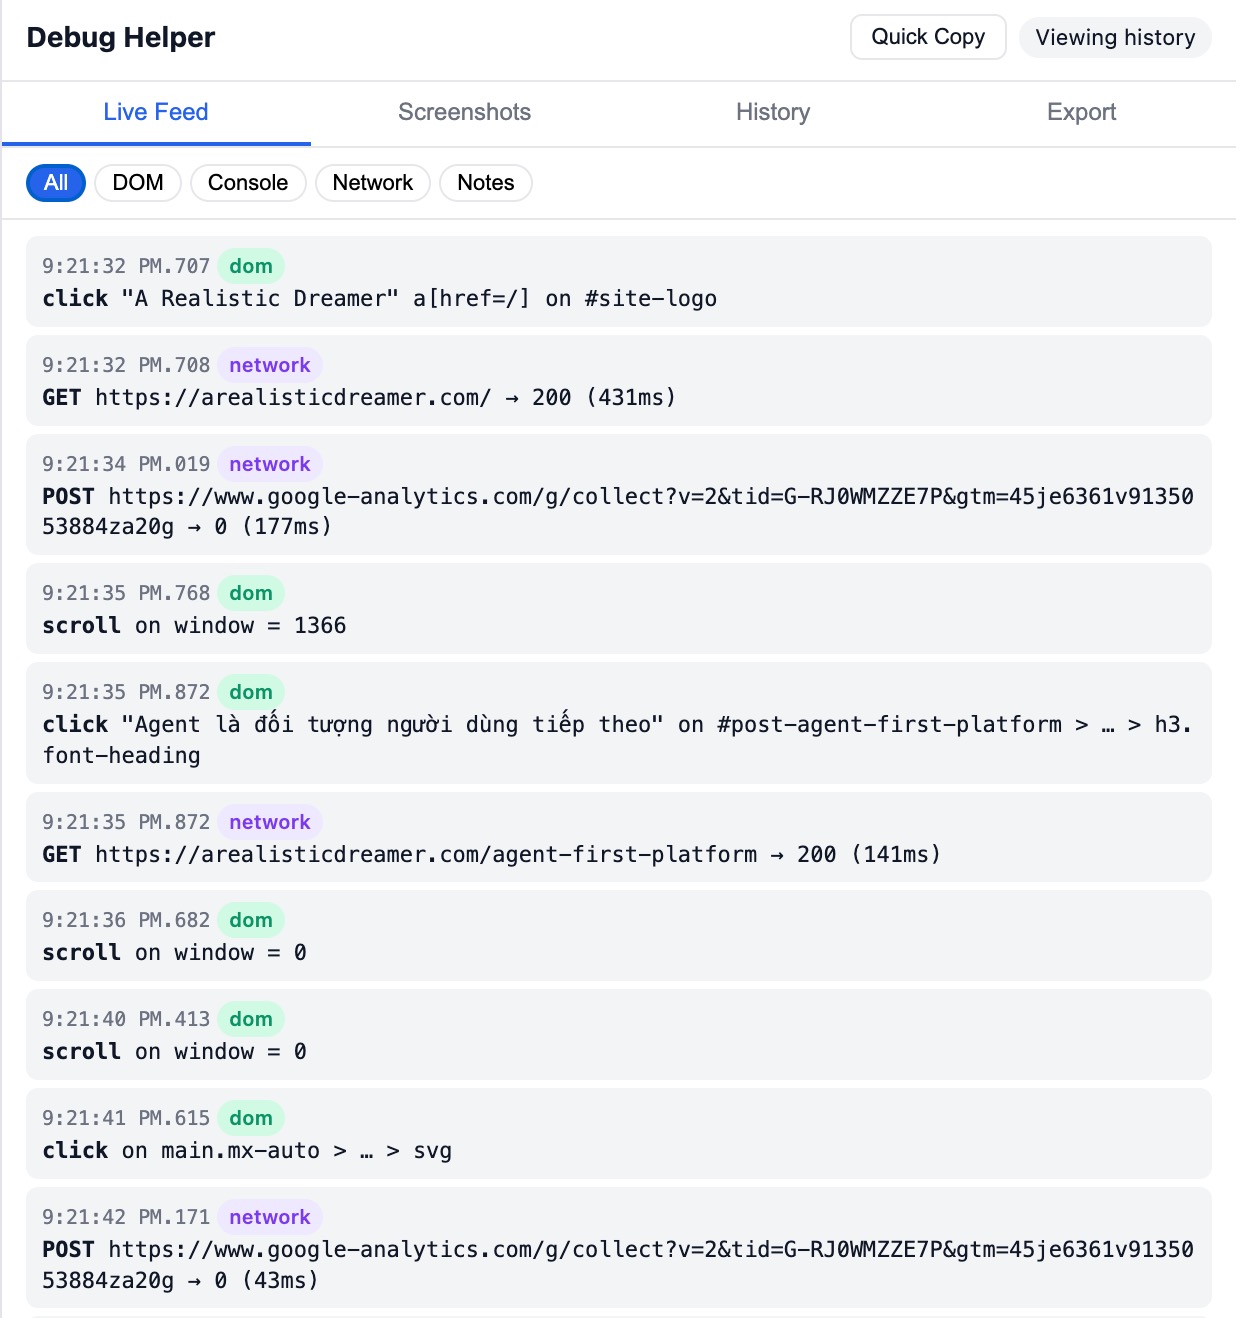
Live Feed
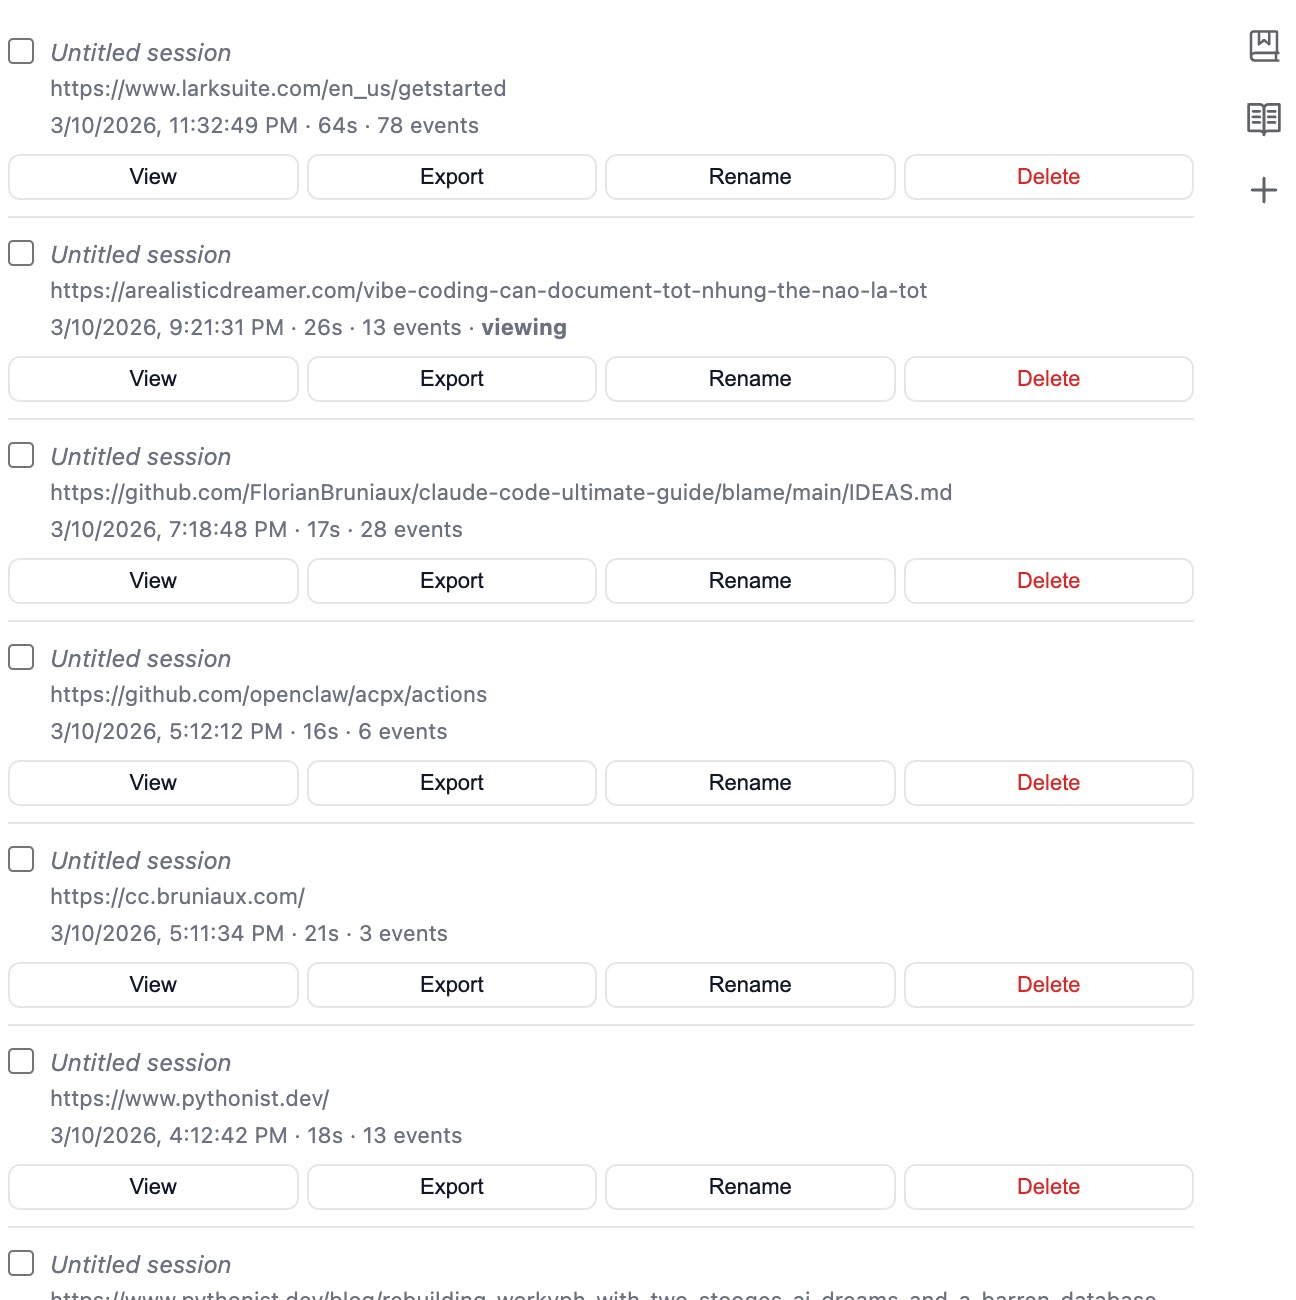
Session History
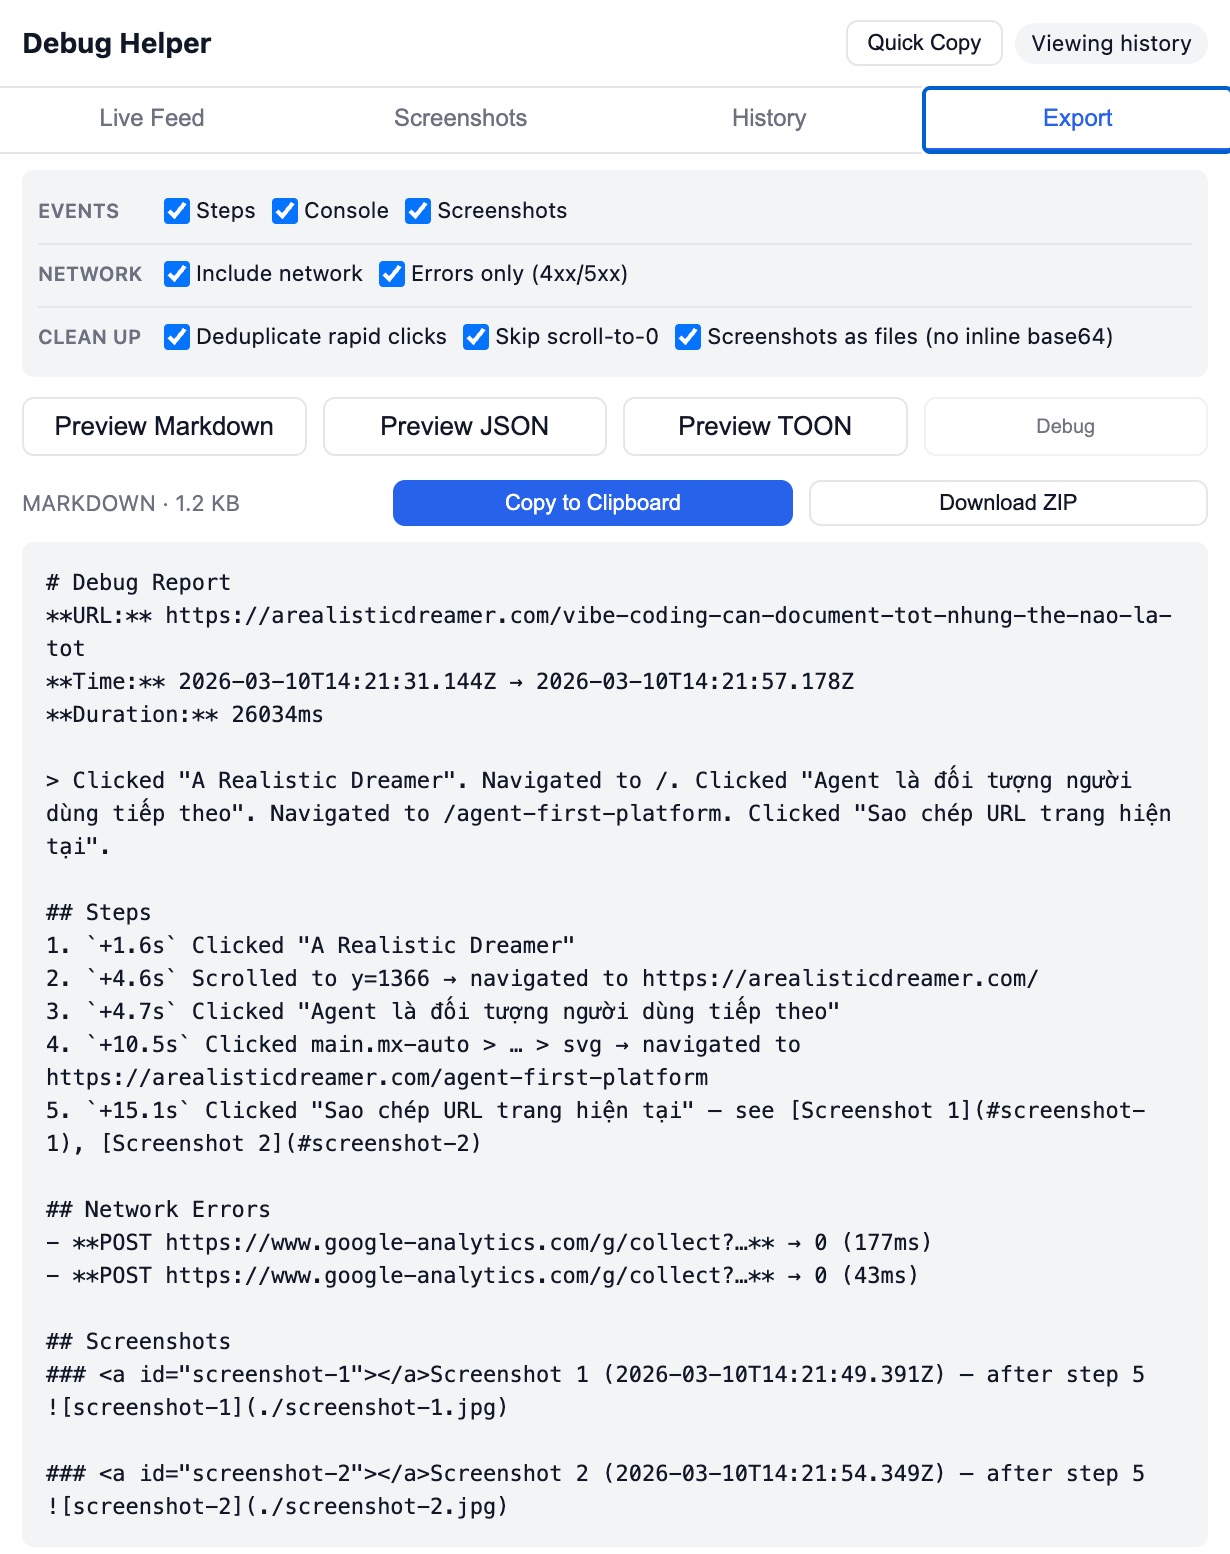
Export Preview
Screenshot Annotator
Chrome extension that captures browser debug context and exports structured reports for AI coding agents.
Clicks, inputs, scrolls, form submissions — recorded with element context, CSS selectors, and timestamps.
Errors, warnings, and logs captured with full stack traces. Sensitive data auto-redacted.
Fetch and XHR calls with status codes, duration, and response bodies for failed requests.
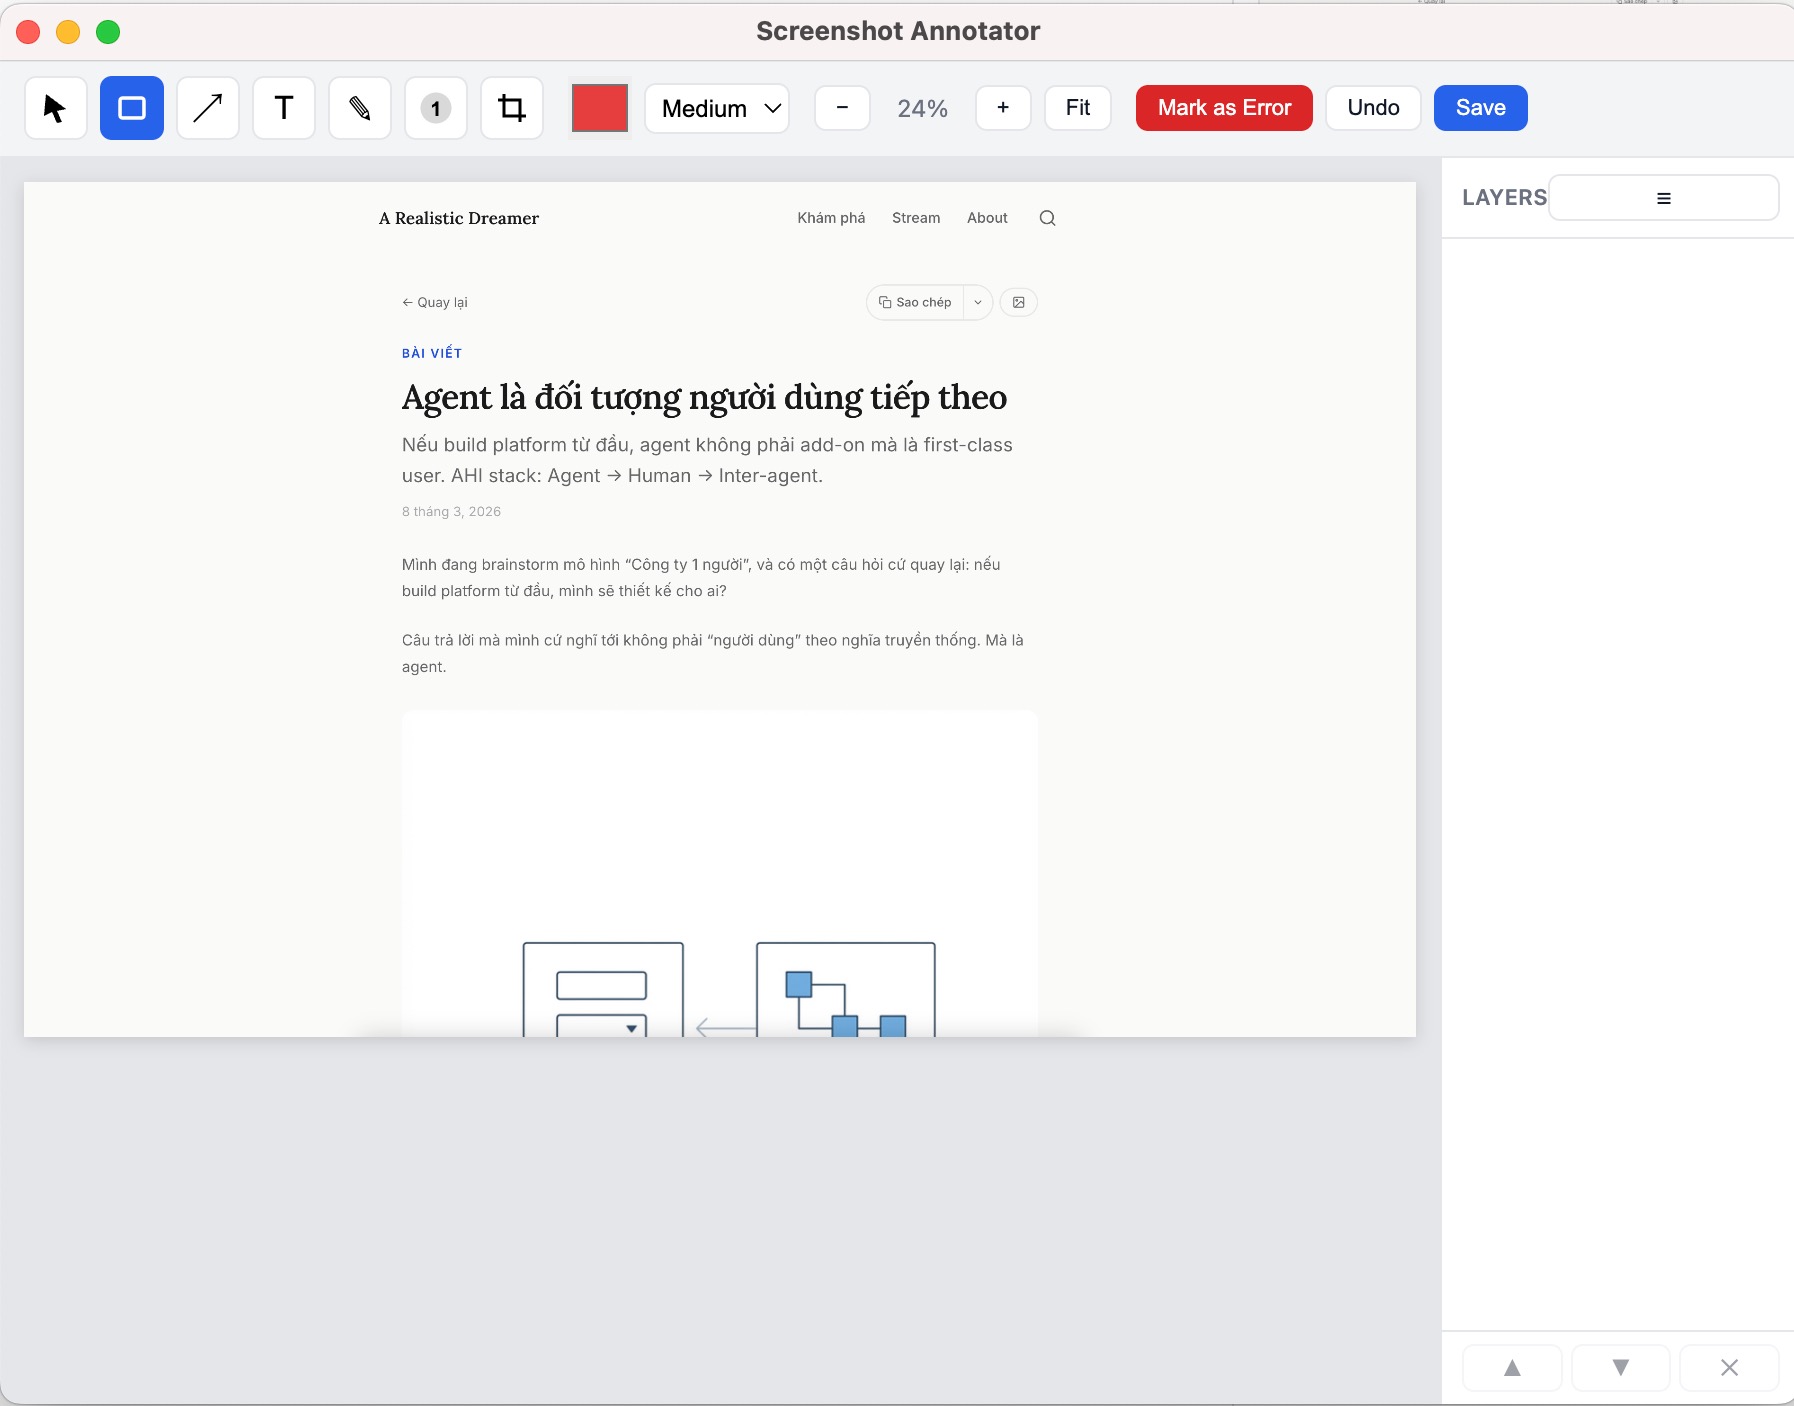
Capture the screen, then annotate with rectangles, arrows, text, counters, and crop. Mark areas as errors.
Collapses rapid duplicate clicks and overlapping input/change/submit events into clean steps.
Markdown for chat, JSON for programmatic use, TOON for token-efficient LLM consumption (~40% fewer tokens).
Paste directly into Claude, Cursor, or any AI coding assistant.
# Debug Report
**URL:** https://example.com
**Duration:** 12400ms

> Clicked "Login". Entered "user@test.com". Submitted form. Note: "Check validation error".

## Steps
1. `+0.3s` Clicked "Login"
2. `+1.2s` Typed "user@test.com" in input#email
3. `+2.8s` Submitted form
4. `+3.1s` Check validation error — see [Screenshot 1](#screenshot-1)

## Console Errors
- **[ERROR]** `+3.2s`: TypeError: Cannot read property 'value' of null

## Network Errors
- **POST /api/login** → 422 (180ms)